
Design QA Inspector
Inspect UI details, pin numbered annotations, try quick CSS fixes, match design tokens, and export QA evidence as PNG, HTML reports, or Jira tickets. Everything stays on your machine.
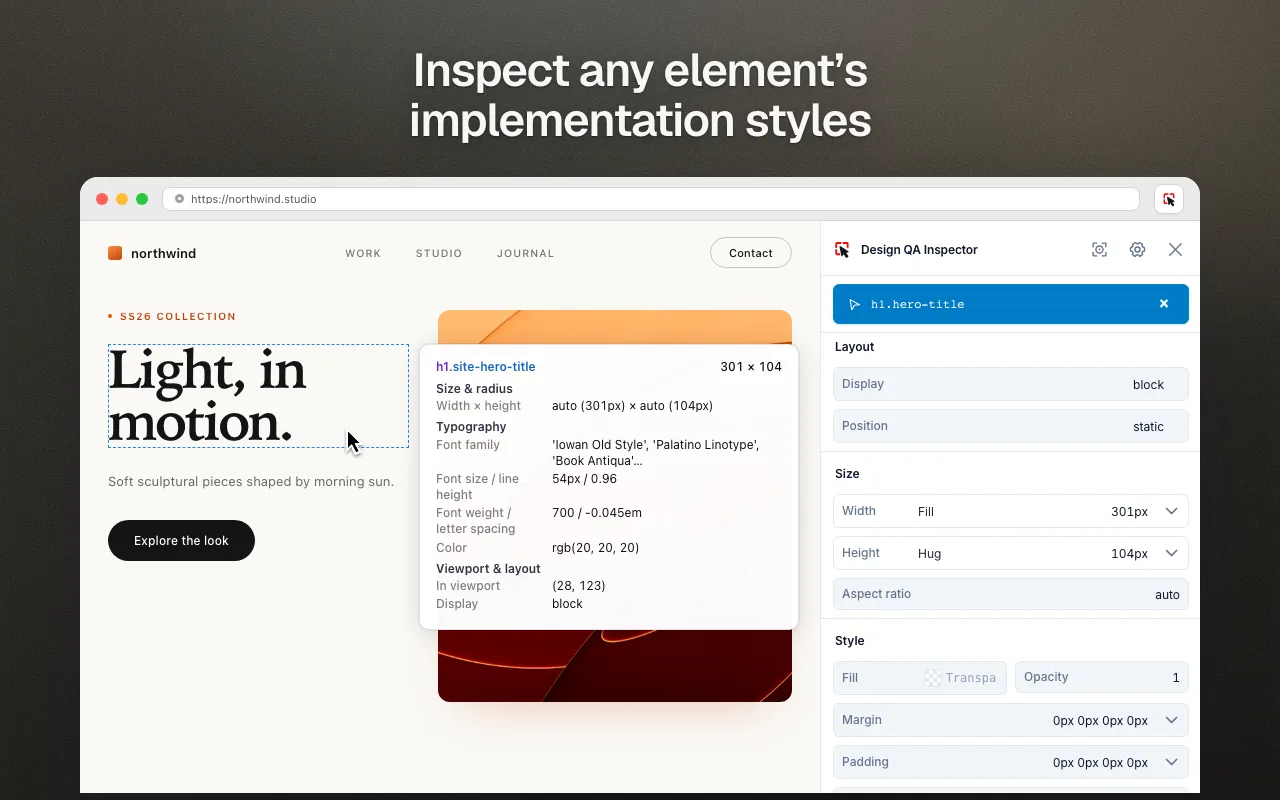
Inspect any element
Click an element to see its selector, size, spacing, color, typography, and layout as actually implemented.
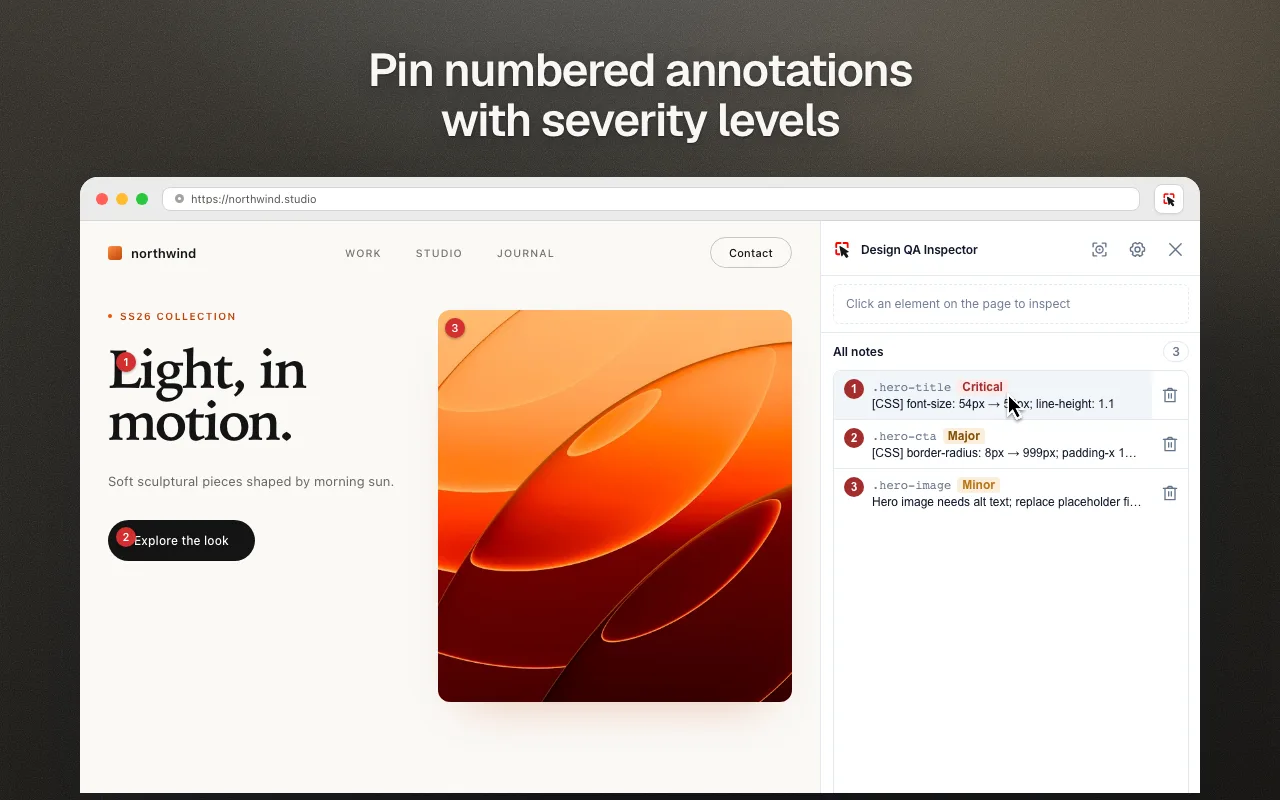
Annotate with severity
Pin numbered notes on the page with severity and status. Notes persist per URL so you can pick up where you left off.
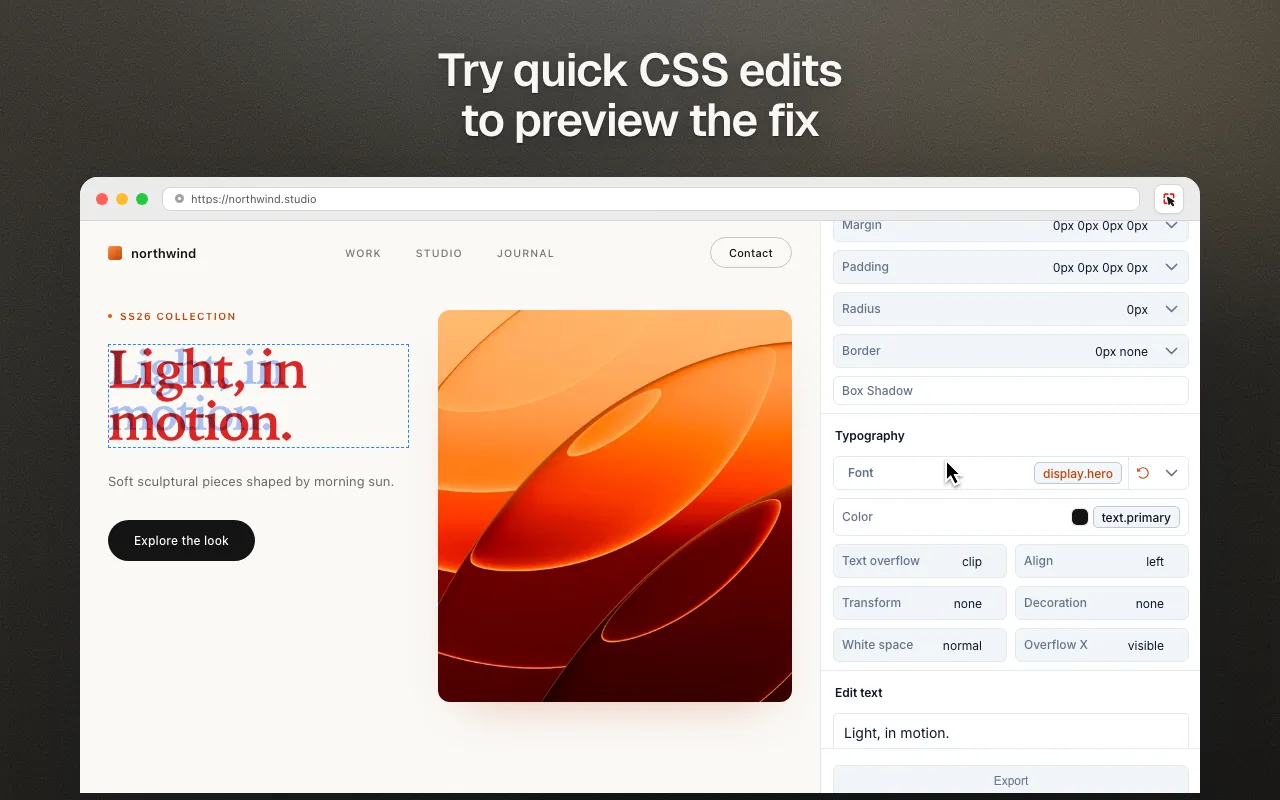
Quick CSS edits
Tweak spacing, color, radius, or type locally to show the expected fix. Import a design-token index to get Token Match suggestions.
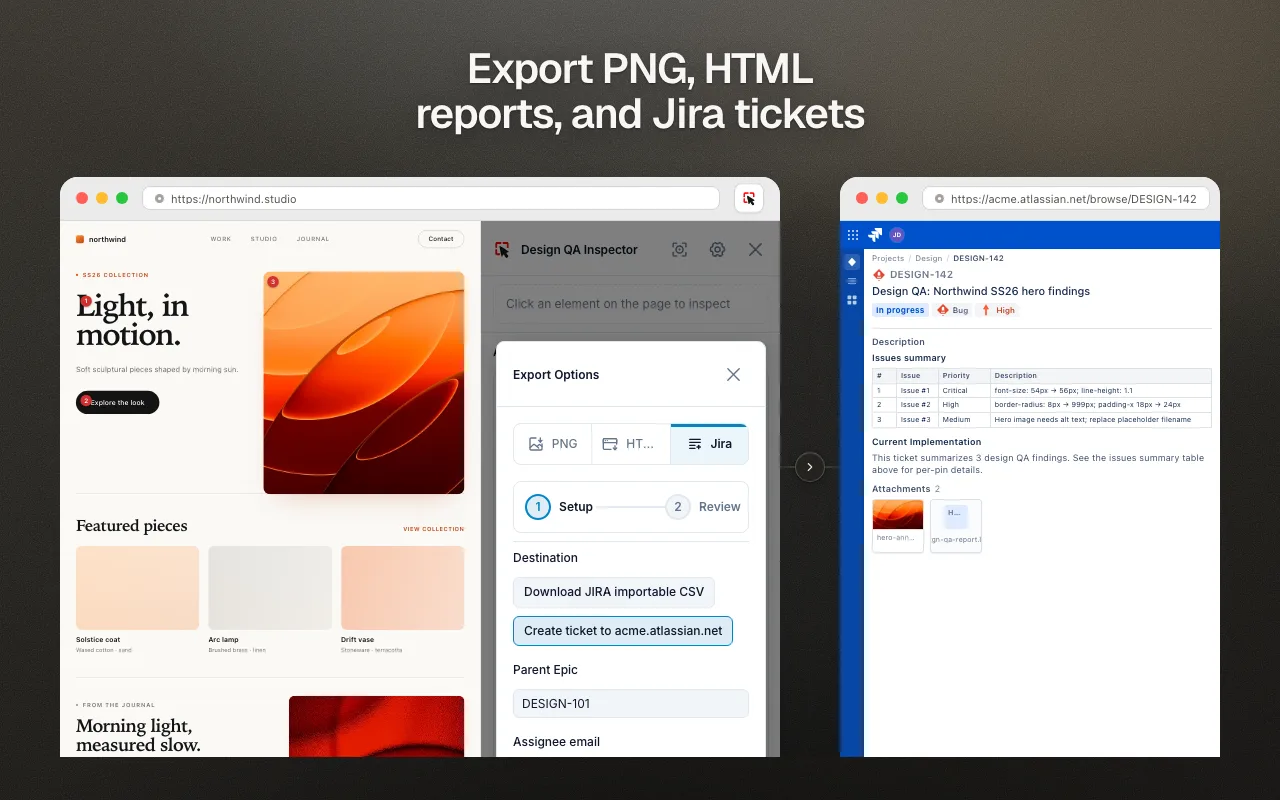
Export PNG, HTML, or Jira
Download annotated screenshots, a standalone HTML report with per-note crops, a Jira CSV, or create tickets directly in Jira Cloud.
Install
- Open the Chrome Web Store listing and click Add to Chrome. Works in Chrome and Edge.
- Open the page you want to review and click the toolbar icon to open the side panel.
- Prefer building it yourself? Clone Ken-pan/design-qa-inspector, run
npm run build, and load thedistfolder as an unpacked extension.
Privacy
No accounts, no analytics, no vendor cloud. Page data is read only on tabs you activate, notes are stored in Chrome local storage, and exports go through Chrome Downloads. Optional Jira or self-hosted Board connections send data only to the URL you configure.
- Restricted browser pages such as chrome:// cannot be inspected.
- Cross-origin iframes and closed Shadow DOM may be limited.
- Full-page capture is best-effort on extremely tall or dynamic pages.
- Jira CSV export is metadata-only; use Create in Jira to attach screenshots.